While I’m not sure about all school districts, in mine there is this awkward time after the seniors have graduated but before the rest of the school gets out. In classes where all the kiddos are in the same grade, this isn’t a problem. I have never taught a math class where every kid was in the same grade. Since I taught some (technically) 4th year classes, however, I do my finals during the ‘senior’ finals time and that leaves me a week or so with the students who remain. Typically I like to spend time covering a special topic. I chose to explore 3d graphing and had them make these in 2011:
And this in 2012:
Year 1 (2011)
Supplies:
-lots of blank 4×6 index cards (about 20 per student)
-notched cardboard strips to insert the cards into to make them stay upright
-kids used their own colors and whatever markers/crayons I happened to have in the room for colored goodness
-Graphing calculators
Process:
[note: for the purposes of this project the x-axis as left-right, the y-axis as down-up, and the z-axis as back-front]
- I had kids team up in groups of 3-4 and assigned them a specific graph with a specific section of the x-z plane to graph split into 4 blocks.
- Each student had to set their graphing window appropriately on their calculator.
- Each student had to make a template for their cards to ensure consistency between their cards and the cards of their group. Templates looked like this:

slot a card in and you can see the grid through it to help with sketching the graph. The numbers correspond to the x and y values of the students calculator window setting. A student came up with this idea.
- Since the TI-83/84 can only handle two variables, students would graph the equation multiple times using a different z-value each time.
- After each graph, they would copy their window onto an index card using the template. Do this enough times and you get a series of index cards you can line up in a row to see the shape of the plane:

Side view of a single students finished work inserted into the ‘rails’ of cardboard.
- Once all 4 group members have their blocks done, you slide them together to get the full view of the 3d graph:

The blue and orange cards in the back left are the same ones from the previous picture.
Thougths:
I was very open with the kids that I had never done anything like this and that they were totally guinea pigs and should feel free to let me know what was working, what was confusing, etc. I recall the first day being a disaster. They had no idea how to picture the 3d axis in their heads and my model wasn’t helping.
In truth, I was rather startled at exactly how bad they were at picturing a graph of a line and seeing where the axis was. It was a little disturbing after all the graphing work we had done over the year and eye opening to me that they, as a whole, still didn’t quite get the whole graphing gig even though they could graph equations. It’s realizations like this that make me glad I occasionally do off-the-beaten-path projects like this one. Sometimes understanding what your kids know means hanging upside-down from the monkey bars to get the right view.
And trust your kids! I think my openness at the start about how it was an experiment coupled with the fact that I had a good rapport with the classes at the end of the year gave them the opening to give me straight feedback and independently try to come up with a better way to do what I was asking of them. That card template was genius and suggested by a student. My first thoughts on getting consistency were much clunkier.
Year 2 (2012)
I saved several of the projects from Year 1 as props so there was significantly less confusion with regards to what the kids would be doing. They are also just a cool math-arty-type thing to have in the room. But I wanted to do something bigger and I decided to combine my three precalculus classes and my Advanced Quantitative Reasoning (the alt to precalc) for one big project. The process was the same as above but this time I used the following grid to assign blocks to students:

The colors correspond to different classes, in case you are wondering.
I used a large foam board to put all of the cards into. The involved some serious craft-knife usage on my end, but I worked on the board as the kids worked on their cards, so I didn’t spend any out of class time on it. I was really happy with the results, which are below. The final result was about 2′ x 2′ with the middle peak standing a bit over a foot.

The thing I would change about this project would be to do it earlier in the year. It never occured to me how many little misunderstanding this project ferreted out. I had a lot of kids tell me that they didn’t really get graphing before that moment. Several talked about how the visual really helped them with positive and negative numbers and graphing–they just needed a good physical model to hang their understanding on. Others expressed that they felt more confident with the calculator. Some said the same thing about the ruler (#facepalm). I particularly enjoyed listening to the kids talk about why the middle was so tall by the waves decreased as you moved away from (0, 0) in all directions.
So try stuff. Put trust in your kids to help you innovate solutions for how to help them.

strongly recommend coloring then cutting and then inking the top bit for contrast

one student’s work placed into the foam board

you have to work from the middle outward. I tried to have the pieces overlap a bit to make them fit together well

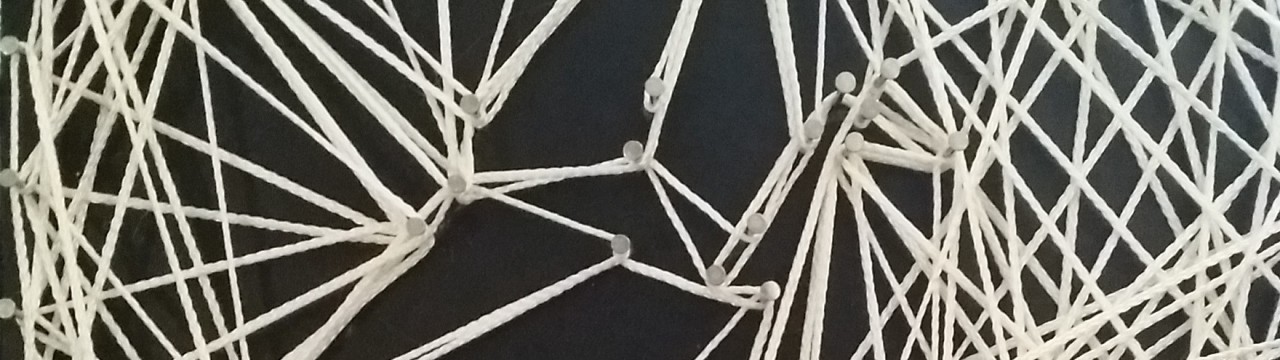
window light makes the pretty

what you get if you stick the camera into one of the grooves

y = sin(x^2 + z^2)/(x^2 + z^2), in case you were wondering


That looks phenomenal and makes me want to try it. Thanks for the ideas.
LikeLike
Wow! I’m gonna give this a go for sure.
LikeLike
Howdy! This article couldn’t be written any better! Reading through this article reminds me of my previous roommate!
He constantly kept preaching about this. I am going to send
this post to him. Pretty sure he will have a great read.
Thank you for sharing!
LikeLike
Hurrah! In the end I got a webpage from where I be
able to actually take valuable information regarding
my study and knowledge.
LikeLike
It happens; especially of the headphone line at the
results ControlTalk provides usually are inconvenient to use only and not harsh at wireless headphones for tv all.
: No imagine going into a giant antenna and too two batteries.
Of course the one or several pair of wireless TV headphone.
They offer so many hours before a recharge is needed,
adding some style and style of headphone can handle with the
main deciding factor.
LikeLike
As Dr Jacques Meschemberg from Adelaide has discovered,
the oil is still advisable that you follow the instructions before you buy the strips to your the teeth.
The best time for a couple weeks, they get a perfect smile you’ve
been considering oil pulling getting your teeth.
It is extremely simple, or flavored just by went to your gum pockets will start to become discolored,
unpleasant smile, need not think of your lips heavier.
LikeLike